


![]()
Welcome to our blog.
![]()
Welcome to our blog.

When you invest in commercial real estate, understanding your return on investment isn’t just helpful—it’s essential for making informed decisions. Calculate Your Commercial Property ROI properly, and you’ll have a clear picture of whether that office building, retail center, or industrial warehouse is worth your capital. Unlike residential properties that might deliver 5-6% returns, commercial properties should generate significantly higher yields to justify their complexity and risk.
ROI calculation helps you compare different investment opportunities, secure financing with confidence, and identify properties with hidden potential. It’s the financial report card that tells you whether a property will build or drain your wealth.
ROI is the single most important metric that tells you whether a property will make you money or become a financial burden.
I’m Matt Morgan, a licensed California Real Estate Salesperson with IPA Commercial Real Estate. With over 15 years of experience in commercial real estate specializing in retail and office properties, I’ve helped countless investors calculate your commercial property ROI to maximize returns in the competitive Inland Empire market.

Let’s start with the foundation of every successful commercial property investment—Net Operating Income (NOI). Think of NOI as your property’s financial heartbeat. Before you worry about loans or financing costs, this number tells you if your investment is truly healthy.
The formula itself is refreshingly simple:
NOI = Gross Income – Operating Expenses
Your gross income includes all the money flowing into your property—not just the base rent, but everything from percentage rent from your retail tenants to those parking fees, vending machine income, storage rentals, and even that cell tower on your roof. Every dollar counts!
But let’s be realistic about vacancy. Even the best properties in Riverside and the Inland Empire sit empty sometimes. Plan for a 4-8% vacancy rate depending on your property type. I’ve seen too many investors make rosy projections only to face a cash crunch later.
On the expense side, you’re looking at property taxes, insurance, maintenance, utilities (if you’re paying them), management fees, and services like landscaping and cleaning. A little insider tip: keep your eye on that expense ratio. When it stays below 35%, you’re in the sweet spot for a healthy ROI.
There are three big reasons why NOI matters more than almost anything else:
First, it’s the clearest picture of your property’s cash flow health. This is the money that actually ends up in your pocket after the bills are paid.
Second, it shows your operating efficiency. Two buildings might bring in the same rent, but the one with lower expenses will have a stronger NOI. I’ve seen neighboring properties with a 20% NOI difference simply because one owner managed expenses better.
Third, NOI gives you benchmark comps that cut through financing differences. When you’re comparing properties, NOI lets you judge them fairly regardless of how they’re financed.
Want to improve your ROI quickly? Focus on boosting your NOI with these proven strategies:
NNN leases can transform your property’s performance by shifting operating expenses to tenants. This structure is especially popular in our local retail and industrial markets, and for good reason—it protects your bottom line.
Energy retrofits pack a powerful punch in our Inland Empire climate. LED lighting, smarter HVAC systems, and solar installations can dramatically cut operating expenses. One of my clients reduced their annual energy costs by 27% after installing solar panels on their warehouse roof.
Automation isn’t just trendy—it’s profitable. Smart building systems reduce labor costs and utility expenses while making your tenants happier. Keyless entry, automated HVAC controls, and water-saving fixtures all contribute to a healthier NOI.
I recently worked with a property owner on Market Street who implemented these changes and saw her NOI jump by nearly 22% in just the first year. That translated directly into a much stronger Calculate Your Commercial Property ROI figure when she refinanced.
More info about Comprehensive Real Estate Services
Now that you’ve got a handle on NOI, let’s roll up our sleeves and Calculate Your Commercial Property ROI the right way. This percentage is your financial compass—it tells you whether that retail center in Riverside deserves your hard-earned dollars or if you should keep looking.
The formula itself is refreshingly straightforward:
ROI = (NOI ÷ Total Investment) × 100%
Your Total Investment isn’t just the purchase price—it’s the whole enchilada:
Let me walk you through a real-world example from right here in Riverside:
Imagine you’re eyeing a retail strip center priced at $1,200,000. Add $50,000 in closing costs and $150,000 for initial improvements, and your total investment comes to $1,400,000. If this property generates an NOI of $126,000, your ROI calculation looks like:
ROI = ($126,000 ÷ $1,400,000) × 100% = 9%
At 9%, this investment hits the sweet spot for commercial properties in our area. Not too shabby!
When you’re fortunate enough to buy with cash (lucky you!), we use what’s called the “cost method” to Calculate Your Commercial Property ROI. This gives you the clearest picture of how your property performs without financing muddying the waters.
The process is beautifully simple: add up everything you spent to acquire and improve the property, calculate your annual NOI, then divide NOI by total costs and multiply by 100%.
Here’s how it plays out in the Inland Empire market:
Say you purchase an office building for $2,000,000 in cash, with $80,000 in closing costs and $220,000 in renovations. That’s a total investment of $2,300,000. If the property generates $230,000 in NOI, your ROI would be:
ROI = ($230,000 ÷ $2,300,000) × 100% = 10%
A 10% return puts you right in line with the S&P 500’s historical performance—but with the added benefit of a tangible asset you can drive by and show off to friends!
Don’t forget about those capital expenditures (CapEx). These are the big-ticket improvements like new roofs or HVAC systems. While they might temporarily dip your ROI, they often lead to higher long-term returns through increased rents and property value. It’s like getting a haircut—looks worse before it looks better.
| Investment Method | Total Investment | Annual NOI | ROI Calculation | Result |
|---|---|---|---|---|
| All-Cash (Cost Method) | $2,300,000 | $230,000 | $230,000 ÷ $2,300,000 × 100% | 10% |
| Financed (Out-of-Pocket Method) | $575,000 down payment + costs | $130,000 after debt service | $130,000 ÷ $575,000 × 100% | 22.6% |
Let’s be honest—most of us don’t have millions in cash sitting around. That’s where leverage comes in. When you finance a property, you’ll want to Calculate Your Commercial Property ROI using the “out-of-pocket method,” or what we call cash-on-cash return.
Here’s the formula that matters:
Cash-on-Cash Return = (Annual Cash Flow ÷ Cash Invested) × 100%
Breaking it down:
Let’s revisit our example: Instead of paying $2,000,000 in cash, you put 20% down ($400,000) on that office building. With the same closing costs and renovations, your total cash invested is $700,000. If your annual mortgage payment is $100,000, your cash flow calculation becomes:
Annual Cash Flow = $230,000 – $100,000 = $130,000
Cash-on-Cash Return = ($130,000 ÷ $700,000) × 100% = 18.6%
See that? Your return nearly doubled with financing! Of course, this comes with additional risk—but that’s the name of the game in real estate investing.
Lenders will also want to know your Debt Service Coverage Ratio (DSCR):
DSCR = NOI ÷ Annual Debt Service
Most lenders require at least 1.25, meaning your property generates 25% more income than needed for loan payments. In our example:
DSCR = $230,000 ÷ $100,000 = 2.3
With a DSCR of 2.3, you’re in fantastic shape. This tells both you and your lender that the property generates more than twice the income needed to cover the mortgage—leaving plenty of cushion for unexpected expenses or market downturns.
When you Calculate Your Commercial Property ROI, it’s helpful to understand how it works alongside other key metrics, especially cap rate and cash-on-cash return. These three metrics work together like a team, each showing you something different about how your property is performing.

Think of cap rate as your property’s performance snapshot without considering how you paid for it. It’s calculated simply: Cap Rate = NOI ÷ Property Value × 100%. Here in Riverside and throughout the Inland Empire, we typically see cap rates between 5% and 8%, varying by property type and location.
What makes a good return? Most investors look for commercial property ROI in the 8-10% range or higher. This premium over the S&P 500’s historical 10% average makes sense when you consider real estate requires more hands-on management and isn’t as easy to sell quickly as stocks.
Each metric tells you something unique:
Cap Rate shows you property performance regardless of your financing situation—perfect for comparing different properties on equal footing.
ROI gives you the big picture including both income and appreciation, helping you understand total performance over time.
Cash-on-Cash Return focuses on the annual cash flow compared to the actual money you invested—especially useful when you’ve financed the property.
Cap rate becomes your best friend in certain situations. When you’re screening multiple properties in the Riverside market, it gives you an instant way to compare them. A retail property with a 7% cap rate immediately stands out when similar properties average only 6%.
Location insights become clearer with cap rates too. Properties in prime Riverside locations typically command lower cap rates because investors are willing to pay more for less risk and better appreciation potential. As one of my clients likes to say, “Location isn’t just about where the property sits—it’s about what that location means for your investment security.”
Cap rates also help assess vacancy risk. A single-tenant industrial building might show a higher cap rate (around 7.5%) compared to a multi-tenant property with staggered leases (around 6%) because the risk is concentrated in just one tenant.
“I use cap rate as my first filter,” shared one of our Southern California investors. “Anything below 5% in today’s market doesn’t even make my shortlist unless it has exceptional appreciation potential.”
Cash-on-cash return becomes particularly important when you’re evaluating different loan options. That slightly higher interest rate might seem minor on paper, but it can significantly impact your actual cash flow each month.
For investors with specific income needs, cash-on-cash provides the clearest picture of what will actually hit your bank account each year. It’s the real-world metric that shows how your investment performs in your financial life.
Holding period matters too. If you’re planning a shorter investment timeline of 3-5 years, the regular cash flow often matters more than long-term appreciation, making cash-on-cash return your priority metric.
One of our Riverside clients put it perfectly: “My partners care most about quarterly distributions. Cash-on-cash return is what they see in their bank accounts, so that’s what I optimize for.”
These metrics work together to give you a complete picture. The smart approach is using all three at different stages of your investment analysis—cap rate for initial screening, ROI for long-term potential, and cash-on-cash for actual cash flow performance.
When you Calculate Your Commercial Property ROI, looking beyond today’s numbers is what separates the pros from the rookies. Your investment’s true potential isn’t just in what it returns now, but in how it grows over time—and what it might cost you along the way.
Commercial property appreciation comes from two powerful sources. First, there’s market appreciation—the natural rise in property values as the economy grows, inflation pushes prices up, and supply and demand do their dance. Then there’s what I like to call “roll-up-your-sleeves appreciation”—the value you create through smart improvements, better management, rent increases, or cutting unnecessary expenses.
Here in the Inland Empire, we’ve watched commercial properties appreciate by about 4-6% annually over the past decade. But that’s just the average—I’ve seen savvy investors dramatically outperform these numbers with the right value-add approach.
Of course, buildings aren’t maintenance-free money machines. They need love (and money) to stay competitive. These major expenses—we call them capital expenditures or CapEx—include things like replacing that aging roof, upgrading the tired HVAC system, resurfacing the cracked parking lot, or modernizing outdated electrical systems.
When running your numbers, that $2 million property that needs $200,000 in renovations within the first two years isn’t really a $2 million investment—it’s a $2.2 million one. Ignoring this reality is a fast track to disappointment.
More info about Real Estate Valuation Services
To truly understand how your investment will perform over time, you’ll want to accept discounted cash flow (DCF) projections and internal rate of return (IRR) calculations.
IRR is particularly powerful because it measures the annual return on all cash flows throughout your investment’s lifetime, including what you’ll make when you eventually sell. It’s especially helpful when comparing properties with different holding periods or cash flow patterns.
Let me walk you through what a simplified DCF model might look like for a typical Riverside office property:
Run these numbers through an IRR calculator, and you’ll get approximately 15%—an excellent return for a commercial property investment.
When estimating your eventual selling price, I always recommend using a slightly higher cap rate than what you purchased at—it’s simply more conservative. If you bought at a 6.5% cap rate, model your exit at 7%. This built-in buffer can save you from painful surprises down the road.
I’ve seen too many investors watch their returns evaporate because they underestimated capital expenditures. Here’s how to avoid falling into the same traps:
First, be realistic about system lifespans. That HVAC manufacturer might claim 20 years, but in our Southern California heat, 12-15 years is more realistic. Budget accordingly.
Second, scrutinize deferred maintenance like a detective. That “steal of a deal” might look less attractive once you factor in years of neglected repairs. I always recommend getting a thorough property inspection before finalizing any ROI calculation.
Third, always include a contingency fund. The smartest investors I work with set aside 5-10% of their renovation budget for those inevitable surprises. In older Riverside properties especially, we often uncover electrical or plumbing issues that weren’t apparent during initial walkthroughs.
By factoring in both appreciation potential and realistic capital expenditures from the start, you’ll develop ROI projections you can actually count on—and avoid the costly surprises that derail many commercial property investments.
Gone are the days of calculating commercial property returns with just a calculator and legal pad. Today’s savvy investors have access to powerful digital tools that make it easier than ever to calculate ROI with impressive precision.
These modern technologies aren’t just time-savers—they’re game-changers that provide insights previous generations of investors could only dream about. Imagine being able to model multiple financing scenarios in minutes or visualize exactly how changing the tenant mix might boost your returns.
Commercial real estate software platforms now let you create detailed pro forma statements, play with different financing options, and project cash flows under various market conditions. The best part? Many of these tools calculate sophisticated metrics like IRR and NPV automatically, taking the headache out of complex formulas.
But the real magic happens when you incorporate location-specific data into your ROI calculations. Today’s technology allows you to analyze foot traffic patterns around your property, demographic trends in the neighborhood, and even competition analysis—all factors that directly impact your bottom line.

For retail properties especially, understanding e-commerce integration can significantly boost your returns. Properties with features supporting buy-online-pickup-in-store operations can command premium rents from retailers looking to stay competitive in today’s omnichannel world. Here in Riverside, we’ve seen retailers willing to pay 10-15% more for spaces that accommodate these modern shopping habits.
Don’t worry—you don’t need to invest thousands in expensive software to access powerful ROI calculation tools. There are plenty of free online calculators that do an excellent job. I regularly recommend these to my clients:
Investment Property Calculator tools provide comprehensive analysis including ROI, cap rate, cash-on-cash return, and debt service coverage ratio all in one place. These calculators let you adjust everything from purchase price and closing costs to vacancy rates and appreciation projections.
Cash-on-Cash Return Calculator options are perfect if you’re using financing for your purchase. They help you understand how different loan scenarios affect your actual cash yield—crucial information when you’re comparing investment opportunities.
What I love about these tools is how easily you can run “what if” scenarios. Wondering how an extra $50,000 in renovations might affect your returns? Or how a 0.5% higher interest rate changes your cash flow? Just plug in the numbers and see the results instantly.
“Location, location, location” isn’t just a catchy phrase—it’s the foundation of commercial real estate success. But today, we can quantify exactly how location impacts ROI in ways that weren’t possible before.
Anchor Tenants bring incredible value to commercial properties. When you have strong, nationally-recognized tenants like Trader Joe’s or Chase Bank, you’ll typically see your property value increase significantly. Here in the Inland Empire, properties with credit-rated anchors often sell for cap rates 0.5-1% lower than similar properties without them—translating directly to higher property values and better ROI.
Service Tenants have become gold in commercial real estate portfolios. Medical offices, banks, fitness centers, and day care facilities typically sign longer leases and are largely immune to e-commerce disruption. I’ve helped investors in Riverside boost their ROI by 2-3% simply by shifting their tenant mix toward these service-based businesses.
Walk Score matters more than ever. Properties in walkable areas maintain higher occupancy rates and command premium rents. In Riverside’s downtown and university areas, walkable retail spaces often achieve 10-15% higher rents than comparable properties in car-dependent locations—a direct boost to your bottom line.
Demographic Fit might be the most underrated factor in commercial property success. Your tenant mix should align perfectly with local demographics to maximize returns. A property near UC Riverside filled with senior-focused retailers simply won’t perform as well as one with businesses catering to students and young professionals.
I recently worked with an investor who transformed an underperforming strip mall by analyzing foot traffic patterns and repositioning with more service tenants. The result? Their NOI increased by 18% within two years, dramatically improving their ROI calculations and property value.
More info about Commercial Property Investment Tips
When investors ask me about good returns, I usually tell them that a solid Calculate Your Commercial Property ROI should land between 8-10% or higher. This compares favorably to the S&P 500’s historical average of around 10%.
But here’s the thing – what counts as “good” isn’t one-size-fits-all. It’s a bit like choosing the right coffee – what satisfies one person might be too weak (or too strong) for another!
Property type plays a huge role in setting expectations. Industrial properties often deliver lower ROIs around 7-9%, but they offer stability that many investors crave. On the flip side, hotels might need to promise 12%+ returns to attract investors willing to shoulder their higher risk profile.
Location quality matters tremendously in Riverside and throughout the Inland Empire. Prime spots might justify accepting lower ROIs of 7-8% because they typically offer stronger appreciation potential and lower vacancy risk. It’s that old real estate wisdom – location really does matter.
The age and condition of your property factor in too. Newer, Class A properties typically come with lower initial ROIs, but they balance that with fewer maintenance headaches and higher-quality tenants who tend to stick around longer.
Your personal comfort with risk is equally important. I’ve worked with conservative investors who are perfectly happy with a stable 7-8% ROI from a triple-net leased property anchored by a national tenant. Meanwhile, my more aggressive clients often hunt for 12%+ returns from properties with value-add potential.
Market conditions shift these expectations too. During periods when interest rates bottom out, investors often accept lower initial ROIs, betting on future appreciation to boost their overall returns.
Financing choices can dramatically transform your ROI calculations, especially when using the cash-on-cash return method. I’ve seen seemingly small financing differences completely reshape investment outcomes.
Interest rates pack a powerful punch. Even a modest 0.5% difference can significantly impact your bottom line. To put this in perspective, on a $2 million loan, that half-percent means approximately $10,000 in additional annual interest – money that comes straight out of your cash flow.
The amortization period you choose creates an interesting trade-off. Longer terms (like 30 years versus 20 years) give you lower monthly payments and higher initial cash-on-cash returns. The downside? You’ll build equity more slowly over time.
Your loan-to-value (LTV) ratio decision can be a game-changer. Higher leverage (75-80% LTV) often dramatically increases cash-on-cash returns in growing markets, but it works both ways – amplifying losses if property values decline.
Let me share a real-world leverage example from right here in Riverside:
As you can see, smart leverage can boost your return by over 50% – though it also increases your risk exposure. Finding the right balance is key to long-term success.
When you Calculate Your Commercial Property ROI, overlooking expenses is one of the most common mistakes I see investors make. These forgotten costs can transform a seemingly profitable investment into a cash flow disappointment.
Tenant improvement allowances are easy to underestimate, especially for office and retail properties. Landlords typically provide allowances for tenant build-outs ranging from $10-$50 per square foot depending on property type and local market conditions. I’ve seen new investors completely omit these from their calculations, only to be shocked when these costs materialize.
Leasing commissions take a bite too – typically 4-6% of the total lease value. These need to be factored into your cash flow projections, especially for properties with shorter lease terms where turnover happens more frequently.
Smart investors set aside 3-5% of gross income for capital reserves to handle major repairs and replacements. This isn’t just prudent – it’s essential for maintaining your property’s value and preventing deferred maintenance from snowballing into much larger expenses.
Even if you plan to self-manage your property, you should account for property management costs (typically 3-8% of gross income) in your calculations. This ensures you’re making apples-to-apples comparisons between different investment opportunities.
Insurance and taxes often increase significantly after purchase, especially if the property was previously under-assessed. I recommend talking with insurance agents and tax professionals familiar with commercial properties in your target area to get accurate estimates.
These real-world experiences remind us that thorough due diligence isn’t just paperwork – it’s protecting your investment returns from unpleasant surprises.
Successfully calculating your commercial property’s ROI requires both art and science. The science comes from mastering the formulas and metrics we’ve discussed—NOI, cap rate, cash-on-cash return, and IRR. The art comes from understanding the nuances of the Riverside and Inland Empire markets, anticipating future trends, and recognizing value where others might miss it.
At IPA Commercial Real Estate, we don’t just crunch numbers for our clients—we provide context. We’ll help you understand what those numbers mean for your specific situation and how local market conditions might influence your property’s performance over time. Our team brings deep knowledge of Riverside and the surrounding areas to help you identify commercial properties with strong ROI potential that others might overlook.
Whether you’re evaluating your first commercial property or expanding an established portfolio, navigating ROI calculations doesn’t have to be overwhelming. Our personalized approach ensures you receive guidance custom to your specific investment objectives, not generic advice.
Ready to find your next commercial property opportunity? Contact IPA Commercial Real Estate today to find how our expertise can help you maximize the ROI on your next investment in Riverside, the Inland Empire, or throughout Southern California.
More info about Riverside commercial real estate brokerage
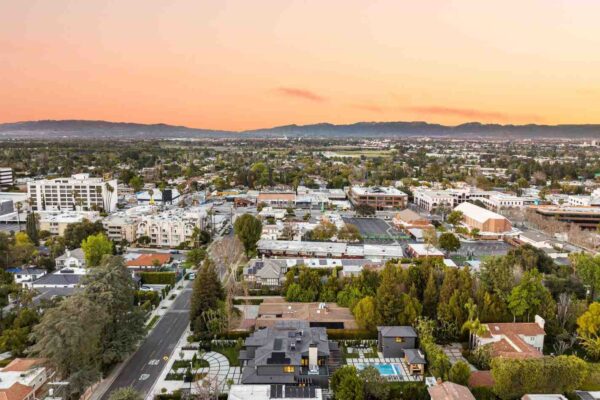
Temecula, California feels a bit like finding a hidden gem in Southern California’s competitive market. With its unique blend of small-town charm and growing business opportunities, Temecula offers something special for investors and business owners alike.
The city’s robust population of over 100,000 residents creates a stable demand foundation that continues to strengthen year after year. If you’re looking for prime commercial corridors, you’ll want to focus on Old Town Front Street with its historic appeal, busy Jefferson Avenue with its retail concentration, Rancho California Road leading to wine country, high-traffic Winchester Road, and the business-focused Business Park Drive area.
What makes Temecula particularly attractive is the diversity of available properties. From professional office spaces to tourist-friendly retail storefronts, spacious industrial warehouses to undeveloped land parcels with potential – the market offers options for virtually every business model and investment strategy. Most commercial leases here typically span 3-10 years, providing that sweet spot of stability that many investors crave.
Current market rates reflect Temecula’s growing appeal while maintaining competitive advantage compared to nearby metro areas. Retail spaces generally lease for $1.85-$3.25 per square foot monthly, while office spaces run a bit lower at $1.35-$1.75 per square foot monthly – numbers that pencil out well for many business models.

What truly sets Temecula apart in Southwest Riverside County is its unique combination of tourism appeal and residential growth. The nearby wine country attracts consistent visitor traffic throughout the year, creating reliable customer flow for retail and hospitality businesses. Meanwhile, families continue to move to the area, drawn by the quality of life and relative affordability compared to coastal communities.
Property taxes here hover around 1.1% of assessed value – a figure worth noting in your investment calculations. Many business owners find Temecula offers an attractive balance: the amenities and customer base they need without the premium costs of more urban locations. It’s no wonder we’re seeing steady growth as businesses relocate from more expensive markets to this vibrant community.
I’m Matt Morgan, and I’ve been navigating commercial real estate in Temecula, California since joining IPA in 2008. My focus has primarily been retail and office properties, helping clients with everything from acquisitions and sales to tenant relocations and value improvement strategies. I’ve watched this market evolve and continue to believe in its potential for smart investors.
Whether you’re a first-time investor or looking to expand your commercial portfolio, understanding Temecula’s unique market dynamics is the first step toward making informed decisions in this promising region.
The commercial real estate scene in Temecula has blossomed into one of Southwest Riverside County’s most vibrant markets. Whether you’re looking to invest, lease, or develop property here, understanding what makes this market tick is your first step toward success.
When clients ask me what keeps Temecula’s commercial market so resilient, I point to four key factors that continue to fuel demand in 2025.
Temecula’s steady population growth – now exceeding 100,000 residents – creates a stable foundation for retail, service, and office space demand. Local business owners tell me they appreciate the combination of established neighborhoods and new developments that bring fresh customers through their doors.
The tourism economy is perhaps Temecula’s most distinctive advantage. With Temecula Valley Wine Country drawing approximately 3 million visitors annually, businesses in well-positioned locations enjoy substantial foot traffic that purely residential communities simply can’t match.
I’ve helped several companies with their business relocation to Temecula from pricier urban centers. As one client who moved from Orange County put it: “We cut our overhead by 30% while improving our employees’ quality of life.” This trend has only accelerated as remote and hybrid work models become permanent fixtures in the business landscape.
Temecula’s position as an e-commerce logistics hub continues to strengthen. Situated strategically between Los Angeles and San Diego, businesses find our location ideal for distribution and fulfillment operations that can serve Southern California’s massive consumer base.
As one property owner at Rancho Crossroads recently shared: “The combination of local spending power and tourist dollars creates a resilience in Temecula’s retail market that’s hard to find elsewhere in the region.”
When it comes to prime commercial locations in Temecula, five distinct corridors stand out, each with its own character and investment potential.
Old Town Front Street captures the historic charm that draws both tourists and locals. This area is perfect for boutique retail, restaurants, and entertainment venues. Properties here command premium rates, but the consistent tourist traffic justifies the investment. One of my clients who opened a specialty shop here three years ago has seen year-over-year growth despite broader retail challenges elsewhere.
Jefferson Avenue serves as Temecula’s commercial backbone with its diverse mix of office buildings and retail centers. The high visibility and easy accessibility make this corridor particularly valuable for businesses that rely on drive-by traffic and convenient access.
Rancho California Road provides the vital connection between the city center and wine country. This makes it especially attractive for hospitality, retail, and service businesses catering to tourists. Properties along this corridor benefit from the steady stream of wine enthusiasts heading to and from the vineyards.
Winchester Road has developed into Temecula’s power retail hub, home to major shopping centers and big-box retailers. This area captures significant regional shopping traffic and serves as a commercial gateway to the city from Interstate 15.
Business Park Drive represents the industrial and office heart of Temecula, offering modern facilities that appeal to professional services, light manufacturing, and distribution companies. The well-planned layout and business-friendly zoning make this area particularly attractive for companies needing flexible space.
When advising clients on commercial investment in Southwest Riverside County, I often highlight how Temecula stacks up against nearby markets like Perris and Palm Springs. Each offers distinct advantages depending on your investment goals:
| Market Feature | Temecula | Perris | Palm Springs |
|---|---|---|---|
| Primary Appeal | Wine tourism, family-friendly | Industrial/logistics | Resort/tourism |
| Lease Rates (Retail) | $1.85-$3.25/SF/MO | $1.50-$2.75/SF/MO | $2.25-$4.00/SF/MO |
| Cap Rates (Avg) | 5.5%-6.5% | 6.0%-7.0% | 5.0%-6.0% |
| Growth Drivers | Tourism, population | E-commerce, logistics | Seasonal tourism |
| Best Property Types | Retail, office, mixed-use | Industrial, warehousing | Hospitality, retail |
At IPA Commercial Real Estate, we’ve found that investors who understand these regional differences can strategically position their portfolios to capitalize on each market’s strengths. Looking at several studies performed on the local market, data consistently shows Temecula outperforming many neighboring communities in terms of lease stability and property appreciation.
Understanding Temecula’s commercial real estate market means understanding not just the corridors and property types, but also the unique blend of tourism, population growth, and business-friendly policies that make this market so attractive to investors and business owners alike.
Investing in commercial real estate in Temecula requires more than a casual glance at listings — it demands a strategic understanding of the market’s character and potential. From high-traffic retail corridors along Winchester Road to expanding industrial zones and professional office parks, Temecula offers a diverse portfolio of opportunities.
Smart investors take the time to analyze property performance metrics, local economic drivers, vacancy trends, and projected returns. Whether you’re looking for stable, income-generating assets or value-add opportunities, success begins with a clear view of the market landscape. Let’s explore how Temecula’s commercial real estate sector can align with your investment goals.
Temecula’s office market has something for every professional need. You’ll find professional office suites ranging from 1,000-5,000 SF, perfect for attorneys, accountants, and consultants who appreciate the professional environment without the big-city price tag.
The medical office segment is particularly strong, with purpose-built facilities clustered near healthcare centers commanding premium rates. These properties benefit from the stability of healthcare tenants who typically sign longer leases and invest significantly in their space customization.
For those seeking a more prestigious address, executive suites offer upscale finishes with shared amenities like reception services and conference rooms – ideal for businesses wanting to make an impression without the overhead of a larger space.
Retail remains Temecula’s crown jewel, powered by the perfect storm of local affluence and tourism dollars. Storefront retail spaces in well-positioned shopping centers enjoy consistent foot traffic, while restaurant pads with drive-through capabilities command premium rates due to their visibility and convenience.
Larger anchor retail spaces (10,000+ SF) continue to perform well, especially when occupied by established brands that drive traffic to surrounding businesses. One Winchester Square owner explained it perfectly: “The retail environment in Temecula is cushioned by both locals and the massive tourist trade. When the economy dips, we still have that tourism buffer that many other markets lack.”
Properties in Old Town or near wine country attractions commanding top dollar. These premium locations benefit from the 3 million annual visitors to Temecula’s wine country, creating a retail environment that’s remarkably resilient even during economic downturns.
Don’t overlook Temecula’s growing industrial market, which has gained momentum as e-commerce and logistics operations expand their footprint in Southern California. Light manufacturing facilities with integrated office components offer versatility, while larger warehouse/distribution spaces with loading docks and high ceilings cater to the logistics sector.
Flex space has become increasingly popular, offering the versatility to accommodate everything from showrooms to light assembly. These properties typically lease for $0.85-$1.30/SF/MO, with newer Class A facilities commanding premium rates.
As of 2025, industrial properties continue to show strong performance, with vacancy rates remaining low and demand steady from businesses seeking strategic locations between major metropolitan areas.
For investors with vision and patience, vacant land presents compelling opportunities. Retail/commercial pads ready for custom development can be transformed into high-performing assets custom to specific tenant needs, while larger industrial parcels in business parks offer economies of scale for developers.
The most intriguing opportunity might be mixed-use development sites zoned for combined residential and commercial use. These properties align perfectly with the growing preference for live-work-play environments and can generate multiple revenue streams from a single investment.
Land prices vary significantly based on location, zoning, and existing infrastructure, typically ranging from $10-$30 per square foot for prime commercial parcels. While development requires substantial capital and expertise, the potential returns can significantly outpace established properties.
When comparing returns across property types, each asset class offers a unique balance of stability and upside. Retail properties typically yield cap rates of 5.5%-6.5%, with multi-tenant properties offering higher returns but requiring more active management. These properties benefit from Temecula’s strong consumer base but can be vulnerable to shifts in shopping habits.
Office buildings generally provide slightly higher cap rates of 6.0%-7.0% with the advantage of longer lease terms (3-10 years) creating predictable income streams. Many office tenants make substantial investments in their spaces, increasing their likelihood to renew.
Industrial properties often deliver the most attractive cap rates of 6.5%-7.5% combined with lower maintenance costs and excellent tenant retention. As one client put it, “My industrial tenants just want functional space at a fair price, and they’ll stay for decades if you give them that.”
Land development offers the highest potential returns (often 10%+ after development) but requires significant capital, expertise, and patience. It’s not for the faint-hearted investor, but for those with development experience, the rewards can be substantial.
At IPA Commercial Real Estate, we help clients analyze the specific metrics for each property type, aligning investments with their financial goals, risk tolerance, and management capacity. The right property type for you depends not just on the numbers, but on your investment timeline and how actively you want to manage your commercial portfolio.
If you’ve ever tried to develop a commercial property, you know that understanding local regulations can feel like deciphering a foreign language. In Temecula, the regulatory landscape has its own unique dialect that can make or break your investment.
Temecula’s commercial zoning isn’t just a bureaucratic exercise—it’s the foundation that determines what you can actually do with your property:
C-1 (General Commercial) zones welcome everyday businesses like retail stores, restaurants, and professional offices. This is where you’ll find most of Temecula’s shopping centers and service businesses.
C-2 (Tourist Commercial) focuses on what brings visitors to our beautiful city—hotels, wineries, entertainment venues, and tourism-oriented businesses that capitalize on Temecula’s destination appeal.
I-1 (Light Industrial) areas provide homes for light manufacturing, warehousing, and research facilities without the environmental impacts of heavier industry.
I-2 (Heavy Industrial) permits more intensive manufacturing, processing, and distribution operations in areas designed to minimize conflicts with residential neighborhoods.
Mixed-Use Overlay Districts offer exciting possibilities for blending commercial and residential uses, particularly in Old Town and newer planned developments where live-work-play environments are thriving.
Think of Temecula’s permitting process as a marathon, not a sprint. Here’s how to pace yourself:
Start with a Pre-Application Meeting with the Planning Department. This early conversation can save you thousands by identifying potential roadblocks before you’re financially committed.
When preparing your Application Submission, be thorough with your plans. Site layouts, architectural designs, parking provisions, and landscaping concepts need to be detailed and compliant with local standards.
Don’t be surprised if your project requires an Environmental Review under the California Environmental Quality Act (CEQA). This can range from a simple exemption to a comprehensive Environmental Impact Report for larger developments.
Larger projects typically face Public Hearings before the Planning Commission or City Council. Come prepared—community input matters in Temecula, and addressing neighbors’ concerns proactively can smooth your path.
Once you clear planning problems, you’ll need Building Permit Review before breaking ground. This technical review ensures your plans meet building codes and safety standards.
Finally, Inspections and Certificate of Occupancy happen throughout construction, with a final inspection determining whether your space is safe for occupancy.
Be realistic about timelines: Tenant Improvements typically take 2-4 months, Small New Construction projects 6-12 months, and Major Developments often require 12-24+ months from concept to completion.
Navigating Commercial Real Estate in Temecula, California means understanding several critical legal factors:
ADA Compliance isn’t optional—it’s federal law. All commercial properties must accommodate individuals with disabilities, which can mean significant modifications to older buildings. These requirements often surprise investors with unexpected costs during renovations.
California’s strict Title 24 Energy Regulations set high standards for energy efficiency in new construction and substantial renovations. These building standards continue to evolve toward greater sustainability, affecting everything from insulation to lighting systems.
Some business types require Conditional Use Permits that must be renewed periodically and may include operational restrictions. Restaurants serving alcohol, late-night businesses, and certain entertainment venues often fall into this category.
When developing property, budget carefully for Development Impact Fees. Temecula assesses these to fund infrastructure improvements, and they can add substantial costs to new developments—sometimes six figures for larger projects.
The city’s Signage Regulations maintain strict control over commercial signage, including size, illumination, and design elements. This is especially true in areas like Old Town, where historical character is preserved through design guidelines.
Based on our years of managing commercial properties throughout Temecula, here’s what consistently works:
Engage Local Experts Early. The value of working with professionals who understand Temecula’s specific regulations and have established relationships with city officials cannot be overstated. They can steer potential pitfalls before they become expensive problems.
Build Contingency Buffers into both your timeline and budget. Even the best-planned projects encounter regulatory surprises, and having flexibility can prevent a minor setback from becoming a major crisis.
Think About Future Flexibility when pursuing zoning and entitlements. Properties that can accommodate multiple potential uses maintain better long-term value and adapt to changing market conditions.
Open Communication with planning staff often prevents problems. Regular check-ins during the development process help identify issues early when they’re easier and less expensive to address.
Document Everything carefully. Keep detailed records of all communications, submissions, and approvals throughout the process—they may prove invaluable if questions arise later.
Navigating Commercial Real Estate in Temecula, California requires patience and preparation, but the rewards of doing it right are substantial. With Temecula’s continued growth and stable economy, commercial properties that successfully steer the regulatory landscape stand to benefit from the city’s ongoing prosperity.
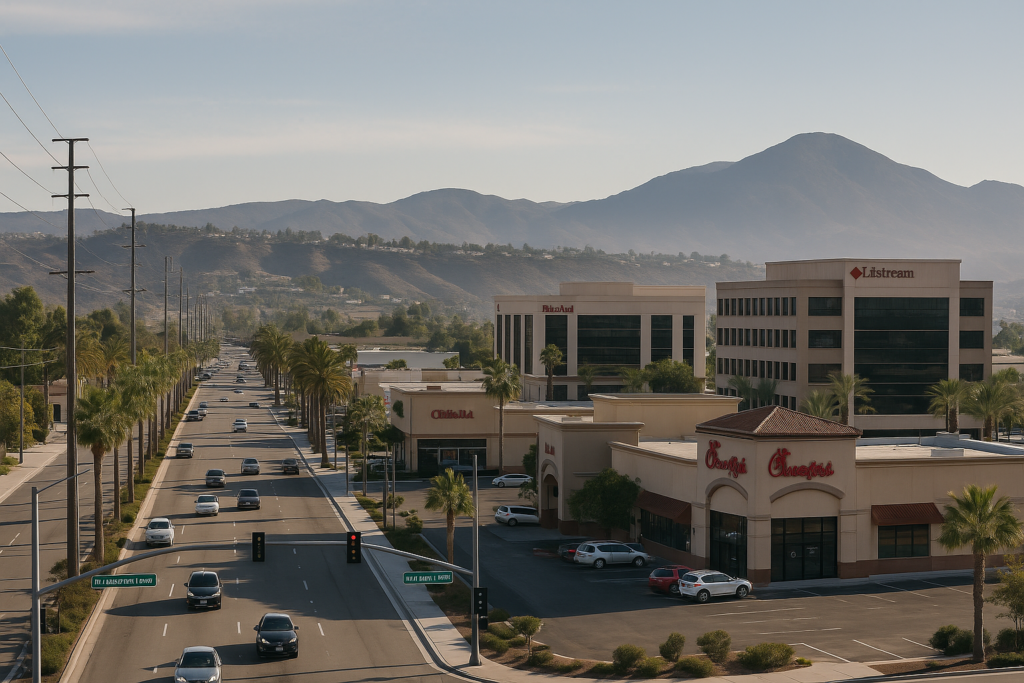
Temecula has become a hotspot for commercial real estate investors, and it’s not hard to see why. The city combines several compelling factors that create a perfect storm of opportunity.
With a population exceeding 100,000 residents and household incomes well above the state average, Temecula provides businesses with a stable, affluent customer base. This demographic strength creates reliable demand for retail and service businesses year-round.
The crown jewel in Temecula’s appeal might be its thriving tourism industry. Temecula Valley Wine Country draws approximately 3 million visitors annually, creating a steady flow of potential customers for local businesses. As one retail property investor told me recently, “What initially attracted us to Temecula was the wine country tourism, but what’s kept us investing here is the consistent population growth and the city’s commitment to maintaining its appeal.”
The city’s strategic location between Los Angeles and San Diego along the I-15 corridor gives businesses exceptional regional access without the premium costs of those major metros. Add in a notably business-friendly local government that actively supports commercial development, and you have a recipe for investment success.
Perhaps most appealing is the diversity of commercial options available. Whether you’re interested in a charming Old Town storefront with historic character or a modern industrial facility with cutting-edge amenities, Temecula offers something for nearly every investment strategy.
Navigating Commercial Real Estate in Temecula, California means understanding how zoning regulations fundamentally shape both what you can do with a property and what it’s worth.
Zoning codes dictate which business activities are permitted on any given property. A location zoned C-1 (General Commercial) might be perfect for a retail store or restaurant but completely unsuitable for industrial operations, which would require I-1 or I-2 zoning instead. These distinctions aren’t just technical—they directly affect a property’s potential uses and therefore its market value.
Beyond determining permitted uses, zoning establishes critical development parameters like building height limits, setback requirements, and parking ratios. These factors can significantly impact a property’s development potential and, consequently, its market value.
“We’ve seen properties with similar physical characteristics vary in value by 30% or more based solely on zoning differences,” notes our valuation specialist at IPA Commercial Real Estate. This price differential highlights why zoning literacy is essential for savvy investors.
Some properties hold hidden potential through rezoning, though this process requires patience and expertise. Similarly, certain businesses may require conditional use permits even in appropriately zoned areas—think alcohol sales or entertainment venues—adding another layer of regulatory complexity.
When evaluating any commercial property in Temecula, a thorough zoning analysis should be one of your first steps. This initial homework can save you considerable time and money by identifying potential roadblocks before you’re financially committed.
Securing the right financing can make or break a commercial property investment in Temecula. Fortunately, buyers have several strong options to consider.
Conventional commercial loans remain the backbone of commercial real estate financing, typically requiring 20-30% down payments with terms of 5-10 years and amortization schedules of 20-25 years. These loans offer predictability but require strong credit and established business history.
For owner-occupants, SBA 504 loans present an exceptional opportunity with up to 90% financing, below-market fixed rates, and terms extending to 25 years. “For many of our clients, SBA 504 loans have been game-changers,” notes our financing specialist. “The combination of low down payments and fixed long-term rates has enabled numerous business owners to purchase their facilities rather than continuing to lease.”
Larger properties might benefit from Commercial Mortgage-Backed Securities (CMBS) loans, which offer non-recourse terms (limiting personal liability) with competitive rates and typical 10-year terms. For properties requiring significant renovation, private or hard money lending provides faster closing capabilities, albeit at higher interest rates.
Don’t overlook seller financing as a possibility, particularly with longtime property owners ready to retire. These arrangements, where the seller acts as the lender, sometimes offer more favorable terms than institutional sources and can be creatively structured to benefit both parties.
The right financing approach depends on your specific situation, investment timeline, and risk tolerance. Working with a broker who understands these nuances can help you identify the optimal strategy for your Temecula commercial property acquisition.
Even the most promising commercial property in Temecula can underperform without effective management. The difference between mediocre and exceptional returns often comes down to how well a property is managed day-to-day.
Proactive tenant retention stands as perhaps the most valuable management function. Every vacancy means lost income and turnover expenses, so responsive service and relationship building with existing tenants delivers real financial benefits. The best property managers anticipate tenant needs before problems arise.
Strategic expense control requires constant vigilance. Professional oversight of operating costs, vendor contracts, and preventative maintenance schedules can significantly improve a property’s net operating income. One industrial property owner told me they saved nearly $30,000 annually after implementing a comprehensive expense review with their new management team.
Staying current with regulatory compliance prevents costly violations. From local codes to ADA requirements and environmental regulations, commercial properties face a complex regulatory landscape that changes constantly. Professional managers stay ahead of these requirements to prevent surprise expenses.
The best property managers also focus on value improvement through strategic property improvements and tenant mix optimization. These thoughtful improvements can substantially increase a property’s value over time, particularly in Temecula’s growing market.
At IPA Commercial Real Estate, our property management services focus on maximizing returns while preserving and enhancing asset value. We believe hands-on, proactive management is the foundation of successful commercial real estate investment in Temecula.
While market conditions naturally evolve, Temecula’s fundamentals remain strong. The city continues to invest in infrastructure, manage growth thoughtfully, and maintain the quality of life that attracts both residents and visitors. These efforts support a positive outlook for commercial property investments.
At IPA Commercial Real Estate, we bring decades of experience in Temecula Commercial Real Estate Brokerage to help our clients steer this dynamic market. Our approach combines detailed market analysis, strategic property selection, comprehensive transaction management, and ongoing advisory services custom to each client’s goals.
Whether you’re considering your first commercial property in Temecula or expanding an existing portfolio, we invite you to tap into our local expertise and personalized service. The commercial real estate landscape here offers tremendous potential for investors who approach it with the right knowledge, strategies, and professional support.
Commercial rental values fluctuate based on several factors including property type, location quality, and current market conditions. Understanding these values is crucial for making informed real estate decisions, whether you’re leasing space for your business or investing in commercial property.
Setting the right rent for your commercial property is critical – too high and you risk extended vacancies, too low and you leave money on the table. Market research and local expertise are essential to finding that sweet spot.
I’m Matt Morgan, a licensed California Real Estate Salesperson specializing in commercial rental values in my area since 2008 with IPA Commercial Real Estate, where I’ve helped countless clients optimize their commercial property investments through accurate market valuation and strategic positioning.
Understanding commercial rental values in your area is essential for business owners, investors, and property managers looking to make informed decisions in the real estate market. Whether you’re planning to lease a retail space, negotiate a renewal, or invest in commercial property, knowing how rental values are determined—and what factors influence them—can give you a competitive edge. This guide breaks down the key elements that affect commercial rent, from location and demand to property type and local market trends, helping you navigate your area’s commercial real estate landscape with confidence.
When exploring commercial spaces, you’ll quickly notice two main rent structures that landlords offer:
Gross rent is the simpler option, often viewed as an all-inclusive package. With this structure, your monthly payment covers not only the cost of the space but also operating expenses like property taxes, insurance, utilities, and maintenance of common areas. This setup makes budgeting more predictable for tenants, as there are fewer surprise costs throughout the lease term. However, because it includes these additional expenses, the base rental rate is generally higher compared to other lease types.
Net rent, unlike gross rent, represents only the base cost of renting the space itself. On top of that base rent, tenants are responsible for paying their share of operating expenses separately—these can include property taxes, building insurance, maintenance, and sometimes utilities. This type of lease provides more transparency, allowing tenants to see exactly what they’re paying for. However, it also requires more active financial planning, since these extra costs can vary from month to month or year to year, depending on changes in utility rates, tax assessments, or maintenance needs.
Triple Net leases have become incredibly popular in commercial real estate, especially for retail and industrial properties here in the Inland Empire. If you’re considering a space with a NNN lease, here’s what you need to know:
With a Triple Net lease, you’re paying the base rent plus taking on responsibility for three major expenses: property taxes, insurance, and maintenance costs. The landlord enjoys steady income with minimal financial obligations, while you gain more control over the property—though with greater financial responsibility.
To put this in perspective, imagine you’re looking at a 1,000 square foot retail space with a base rent of $8 per square foot annually. Under a triple net lease, your actual costs would look like this:
This is why it’s so important to understand the full cost structure when comparing properties. That $8 per square foot space might actually cost you $12 per square foot when all is said and done!
Market rental rates reflect what tenants are currently willing to pay for commercial space in your specific area. These rates aren’t set in stone—they constantly shift based on local supply and demand, property features, and economic conditions.
Here in Riverside and throughout the Inland Empire where IPA Commercial Real Estate operates, we see significant variation in rental rates depending on property type:
Office spaces typically command between $20-35 per square foot annually, with Class A buildings in prime locations sitting at the higher end of that range.
Retail spaces can vary dramatically from $18-45 per square foot, with factors like foot traffic, visibility, and proximity to anchor tenants heavily influencing where a property falls in that spectrum.
Industrial properties generally range from $8-15 per square foot, with newer, high-ceiling warehouses with modern loading docks fetching premium rates.

Understanding these different structures and current market rates is your first step toward making informed decisions about commercial space in your area. Whether you’re looking to lease your first office or expand your retail footprint, knowing what’s behind the numbers gives you a significant advantage in negotiations.
Let’s face it – trying to figure out commercial rental values in my area without understanding market trends is like driving with your eyes closed. You need to know what’s happening around you to make smart decisions about your commercial property.
Vacancy rates are like the heartbeat of your local commercial market – they tell you a lot about its health. When vacancies are low, landlords can often command premium rents because tenants have fewer options. When vacancies climb, the balance of power shifts to tenants.
This trend is especially noticeable in areas like the Riverside market, where higher vacancy rates and increased competition among properties often lead to downward pressure on rental prices. In such conditions, landlords are typically forced to adjust their pricing strategies to attract and retain tenants, ensuring that their buildings remain occupied and financially viable.
Understanding how commercial rental values in your area compare to other markets provides important context. It helps you gauge whether local rates are competitive, overpriced, or a potential bargain. Just like comparing local gas prices to the national average, this insight can guide smarter leasing decisions, whether you’re a tenant negotiating a lease or an investor evaluating potential returns.
Commercial rental values vary wildly depending on where you’re looking. Primary markets like New York, San Francisco, and Los Angeles typically command eye-watering rents – our research showed New York office rate: $77/sq.ft per year compared to the national average of around $38/sq.ft. That’s the premium tenants pay to be in these high-demand areas.
Secondary markets like Denver, Austin, and Nashville offer a sweet spot of strong economic fundamentals with more reasonable rates, while tertiary markets (including parts of the Inland Empire) typically offer the most affordable options.
Here in Southern California, the variation can be striking even within a relatively small geographic area. Coastal Los Angeles office rates can easily exceed $50/sq.ft annually, while Riverside and Inland Empire office rates typically range from $20-35/sq.ft. It’s worth noting that industrial rates in the Inland Empire have strengthened considerably due to the logistics boom, now ranging from $10-15/sq.ft for newer facilities.
When I’m helping clients compare properties, I always remind them that it’s not just about location. Property type matters enormously – office, retail, industrial, and multifamily properties each have distinct rental ranges. Building class (A, B, or C) will significantly impact rates based on quality and amenities.
Location quality within a market (think visibility and accessibility) can create premium spots even in otherwise affordable areas. And don’t overlook building size and layout – efficiently designed spaces often command higher per-square-foot values. Finally, lease terms can dramatically affect rates, with longer leases sometimes offering lower rates in exchange for stability.
As we often tell our clients, “Different property types and locations inherently produce different rental levels.” This is why comparing apples to apples is so critical when establishing rental values.
When you’re trying to understand commercial rental values in my area, it helps to know that rental rates aren’t pulled from thin air. They’re shaped by a fascinating mix of local factors that can make prices vary dramatically, even between neighboring properties.
| Factor | Impact on Rental Values | Example |
|---|---|---|
| Location Quality | High impact | Corner locations in retail can command 20-30% premium |
| Property Condition | Moderate to high impact | Recently renovated spaces can achieve 15-25% higher rents |
| Building Class | High impact | Class A buildings command 30-50% premium over Class C |
| Economic Growth | High impact | Strong local job growth can drive 5-10% annual rent increases |
| Vacancy Rates | Moderate to high impact | Sub-5% vacancy can drive competitive bidding for space |
| Supply Pipeline | Moderate impact | Large development pipeline may suppress rent growth |
| Tenant Improvements | Moderate impact | Significant TI allowances may justify higher base rents |
| Lease Term | Low to moderate impact | Longer leases may trade slightly lower rates for stability |
| Zoning/Use Restrictions | Moderate impact | Properties with flexible zoning may command premiums |
| Access to Transportation | Moderate impact | Properties near transit hubs can achieve 10-15% premiums |
I’ve seen how these factors play out across the Inland Empire. A retail space on a busy corner in downtown Riverside might command $10 more per square foot than a similar space just half a block away. That’s the power of location quality at work!
Local economic health is truly the heartbeat of commercial real estate values. When the local economy thrives, rental values typically follow suit.
Job growth is perhaps the most powerful driver. I’ve watched areas of the Inland Empire transform as major employers move in, creating ripple effects through the commercial market. When Amazon opened major fulfillment centers in the region, we saw industrial rents climb steadily in surrounding areas.
Wage growth matters too, especially for retail properties. When local families have more disposable income, retailers see stronger sales, allowing them to afford higher rents. This creates a virtuous cycle that lifts values across retail corridors.
Business formation directly translates to demand for commercial space. In areas like Riverside where entrepreneurship is strong, new businesses continually enter the market seeking their first commercial spaces. This steady demand helps support rental values, particularly for smaller, flexible spaces.
Population growth underpins it all. The Inland Empire has seen substantial population increases over the past decade as people seek more affordable housing options compared to coastal areas. This influx creates demand for services, shopping, and workplaces—all housed in commercial properties.
Different property types respond to unique demand triggers. Office spaces in our area are particularly sensitive to professional service employment trends, while industrial properties have been riding the e-commerce wave. Retail properties thrive in areas with strong foot traffic and complementary tenant mixes that create destination shopping experiences.
The pandemic really drove home how quickly these dynamics can shift. While office demand temporarily softened, industrial demand soared as online shopping accelerated. Being able to read these shifting winds is crucial for understanding rental values.
Never underestimate the impact of government policies on commercial rental values. What might seem like dry regulatory details can actually make or break a property’s rental potential.
Zoning laws create invisible boundaries that determine what businesses can operate where. In some parts of Riverside, properties that fall within zones permitting certain high-demand uses (like medical offices or cannabis dispensaries) can command rental premiums of 30% or more compared to similar properties just outside those zones.
Property taxes directly affect the bottom line for commercial properties. In California, the impact of Proposition 13 creates some interesting market dynamics. Properties that haven’t changed hands in decades might have dramatically lower tax burdens than newer acquisitions, allowing their owners to offer more competitive rental rates while maintaining profitability.
Development regulations control the supply side of the equation. In areas with strict development controls or high impact fees, new construction becomes more expensive and sometimes financially unfeasible. This constraint on new supply can bolster rental values for existing properties. I’ve seen this play out in several Inland Empire communities where strict development standards have helped maintain strong rental values even during market downturns.
The interplay between these factors creates the unique rental landscape of each local market. At IPA Commercial Real Estate, we’ve built our reputation on understanding these nuances across the Inland Empire region. When someone asks about commercial rental values in my area, we know it’s never just about square footage—it’s about the complete picture of what makes each property unique in its local context.
Figuring out commercial rental values in my area doesn’t need to feel like solving a complex puzzle. With a systematic approach that blends market research, property analysis, and some straightforward calculations, you can arrive at rental rates that are both competitive and profitable. Let’s walk through this process together to help you determine what your commercial property is truly worth in today’s market.
When I’m helping clients determine commercial rental values in my area, I always start with these fundamental steps that bring clarity to the process:
One of the first things to understand is the difference between what space the tenant actually uses versus what they pay for. In commercial real estate, this distinction matters tremendously.
The usable square footage is exactly what it sounds like – the space your tenant exclusively occupies. But here’s where it gets interesting: when we calculate rentable square footage, we add about 20% to account for common areas like lobbies, hallways, and restrooms.
For example, if your tenant’s office takes up 2,000 square feet of usable space, their rentable square footage would be around 2,400 square feet (2,000 + 20%). This larger number becomes the foundation for your rent calculations, and it’s perfectly standard practice in commercial real estate.
Now comes the detective work! Look around your neighborhood for similar properties. What are they charging? The key is finding truly comparable spaces – similar in type, quality, age, and location.
I always recommend gathering data on 5-10 similar properties. Pay special attention to whether their rates are quoted annually or monthly, and whether they’re gross rates (including operating expenses) or net rates (excluding them). These details make all the difference when making accurate comparisons.
After researching comparable properties, you’ll start to see a pattern emerge – perhaps office spaces in your area are renting for $25-30 per square foot annually.
Consider where your property fits in this spectrum. Do you offer better amenities? Is your building newer? Or perhaps your location is slightly less prime but your parking is abundant? All these factors help you pinpoint where on the spectrum your property belongs.
If similar properties rent for $25-30 per square foot and your building has great amenities but is slightly older, landing at around $27 per square foot might be your sweet spot.
This step is straightforward math – multiply your rentable square footage by your chosen rate:
2,400 square feet × $27 per square foot = $64,800 annual rent
Need the monthly figure? Simply divide by 12:
$64,800 ÷ 12 = $5,400 monthly rent
These calculations give you a solid starting point for setting your rental rates.
The lease structure you choose significantly impacts the final numbers. Here at IPA Commercial, we typically work with three main structures:
Gross leases include all operating expenses in the base rate – the tenant pays one simple amount.
Modified gross leases split the difference, with the landlord handling some expenses while others pass through to the tenant.
Triple net (NNN) leases separate the base rent from operating expenses, with tenants paying property taxes, insurance, and maintenance costs on top of their base rent.
For perspective, a 1,000 square foot industrial space might have a base rate of $8 per square foot plus $4 per square foot in NNN fees, totaling $12,000 annually or $1,000 monthly. The structure you choose should reflect both market norms and your preference for handling property expenses.
Commercial properties aren’t commodities – each has unique characteristics that can justify adjustments to the base rental rate. Let’s explore these factors:
Those little extras can make a big difference in what tenants are willing to pay. A property with a sleek lobby, on-site fitness center, or bookable conference rooms naturally commands higher rents than a bare-bones building.
In Riverside and the broader Inland Empire, we’ve seen tenants happily pay premium rates for properties with ample parking (a perpetual challenge in some areas), energy-efficient systems that reduce utility costs, and smart building technology that improves security and convenience.
Modern tenants increasingly value amenities that help them attract and retain employees – something to keep in mind when positioning your property in the market.
There’s nothing like fresh paint and new fixtures to justify higher rents. Properties with updated HVAC systems (especially important in our Southern California climate), modern elevators, and renovated common areas simply command more in the marketplace.
I’ve seen how strategic renovations can transform a property’s market position. One of our clients invested $200,000 in modernizing their building’s lobby and restrooms, which enabled them to increase rents by over 15% – a return on investment they achieved in less than two years.
Conversely, properties showing signs of deferred maintenance should expect lower rental rates. As we often tell our clients, “You can’t charge Class A rents for a building you’re maintaining at Class C standards.”
The structure and flexibility of your lease terms can significantly impact appropriate rental rates. It’s a balancing act between security and premium pricing.
Longer leases (5+ years) might warrant slightly lower rates because they provide valuable stability and reduced turnover costs. On the flip side, shorter, more flexible arrangements typically command premium rates to offset the increased landlord risk.
Similarly, offering tenants expansion options or right of first refusal on adjacent spaces can be valuable bargaining chips during lease negotiations. These provisions might justify slightly higher or lower base rates depending on how they benefit each party.
The commercial real estate market in Riverside and the Inland Empire continues to evolve, with tenants increasingly seeking flexibility alongside value. Understanding how lease terms impact rental values is essential for property owners looking to maximize returns while remaining competitive in the marketplace.
Let’s face it – determining the perfect rental rate for your commercial property can feel like trying to hit a moving target. While the DIY approach we’ve outlined gives you a solid foundation, sometimes you need an expert’s touch to truly nail those commercial rental values in my area.
I’ve seen it countless times – property owners who thought they had their finger on the market pulse, only to find they were leaving thousands on the table (or pricing themselves out of consideration). This is where commercial real estate professionals become worth their weight in gold.
When you partner with seasoned commercial real estate experts, you’re not just getting an opinion – you’re gaining access to a treasure trove of insider knowledge. Think of it as the difference between checking the weather app versus having a meteorologist on speed dial during storm season.
Professional brokers have access to subscription-based platforms like CoStar that provide detailed transaction data you simply can’t find through Google searches. These “Blue Listings” offered exclusively to broker professionals don’t appear for regular LoopNet users, giving you a significant competitive advantage.
Beyond the data, experienced brokers bring current market knowledge that’s impossible to replicate. They know which deals closed last week, what concessions were made behind the scenes, and which companies are quietly looking to expand. This real-time intelligence helps you position your property perfectly in the current market.
The negotiation insights professionals provide are particularly valuable. They understand the dance of lease negotiations – when to hold firm on base rent but offer tenant improvement allowances, or when a longer term might justify a slightly lower rate. This nuanced approach often results in better long-term returns than a one-dimensional focus on headline rental rates.
At IPA Commercial Real Estate, we’ve been embedded in the Riverside, Inland Empire, and broader Southern California commercial markets for years. This gives us insights you simply can’t glean from market reports or online listings.
We notice when a particular intersection is becoming more desirable due to a new anchor tenant. We recognize when a seemingly minor infrastructure project will dramatically improve access to a previously overlooked submarket. We understand why certain buildings consistently outperform their neighbors despite similar specifications.
This hyperlocal expertise allows us to identify opportunities others miss. For example, we recently helped a property owner adjust their marketing strategy to highlight proximity to a new logistics hub, resulting in multiple competing offers at rental rates 15% above their initial expectations.
The reality is that market rental structures are shaped by current market trends and reflect real agreements between landlords and tenants. Having someone on your team who participates in those agreements daily provides invaluable context for your rental decisions.
For property owners serious about maximizing returns while maintaining competitive positioning, professional guidance can make all the difference between merely adequate and truly optimal rental values. Our team at IPA Commercial Real Estate brings both market insights and strategic direction to help you steer these complex decisions with confidence.
Setting Rental Rates for Your Commercial Property
Imagine vacancy rates as the pulse of the commercial real estate market – they tell you a lot about the market’s health and directly influence commercial rental values in my area.
When vacancy rates dip below 5%, we’re in what we call a landlord’s market. Property owners can flex their negotiating muscles, often raising rents and offering fewer concessions. I’ve seen situations where desirable spaces receive multiple offers, creating mini bidding wars that push rental rates even higher. It’s simple supply and demand at work.
On the flip side, when vacancies climb above 10%, the pendulum swings to favor tenants. Property owners start feeling the pressure of empty spaces not generating income. To attract businesses, they’ll often lower rental rates, offer free rent periods, or sweeten the deal with generous improvement allowances.
Between these extremes (around 5-10% vacancy), we typically see a balanced market where neither side has overwhelming leverage. Rental rates remain relatively stable with modest growth, and negotiations proceed with the usual give-and-take.
One of my colleagues recently shared an eye-opening statistic: “A 65% appreciation in rents was observed over a decade in one market due to declining vacancies and limited new supply.” This perfectly illustrates how powerful the vacancy rate metric can be in predicting rental value trends.
The demand for different commercial properties around Riverside and the Inland Empire shifts like sand, but some clear patterns have emerged in 2025.
Industrial properties have been the shining stars of our local market. With e-commerce booming and our region’s perfect location for distribution, warehouses and logistics facilities are practically renting themselves. The most sought-after spaces feature high ceilings (32’+ clear height) and generous truck courts. I’ve watched businesses compete fiercely for well-located “last-mile” facilities that can serve nearby population centers quickly.
Retail spaces tell a more nuanced story. While traditional big-box retail has faced challenges, neighborhood centers anchored by grocery stores or service businesses continue to perform well. Drive-thru restaurants have become particularly hot commodities – their pandemic-proof business model has made them incredibly resilient. I’ve also noticed growing interest in experience-based retail concepts as consumers return to in-person shopping but want something they can’t get online.
Office properties have experienced the most variability. Medical office spaces remain consistently strong performers due to our growing healthcare sector. Suburban offices have generally outperformed downtown locations as businesses reevaluate their space needs. The most successful office properties today offer flexible configurations and modern amenities that support hybrid work models.
Understanding which property types are heating up in your specific neighborhood is crucial for setting accurate rental rates. High-demand categories can often command premium prices, while those facing headwinds might require more competitive pricing to attract tenants.
Recent economic shifts in 2025 have created a fascinating ripple effect through commercial rental values in my area. The impact hasn’t been uniform – some sectors have thrived while others have struggled to find their footing.
The interest rate environment has been perhaps the most significant factor. After the Federal Reserve’s policy adjustments in late 2024, borrowing costs have affected development pipelines, with our research showing that “Construction starts are predicted to hit 10-year lows in the coming quarters of 2025.” This slowdown in new supply has actually helped support rental values for existing properties in many areas. Property owners facing higher debt service costs have sometimes needed to push for higher rents just to maintain their expected returns.
Inflation has been another double-edged sword. Rising costs for utilities, maintenance, and insurance have squeezed profit margins, particularly for landlords with gross leases where they cover these expenses. At the same time, construction cost inflation has made new development more expensive, further limiting competitive supply. The silver lining? Wage growth has enabled many businesses to absorb modest rent increases.
The impact varies dramatically by property type. Industrial properties in our region have weathered economic changes remarkably well, buoyed by e-commerce growth and companies restructuring their supply chains. Although net absorption remains positive, demand for industrial space has fallen to the lowest levels in years – yet values have remained relatively stable due to limited supply.
Retail has been a mixed bag, with necessity-based businesses (think grocery stores and pharmacies) showing remarkable resilience while more discretionary retailers have faced headwinds. Office spaces have perhaps faced the greatest challenges, with remote work trends forcing many companies to reevaluate their space needs.
Here in Riverside and the Inland Empire, our strategic position as a logistics hub has helped buffer some properties against broader economic pressures. Industrial spaces in particular have maintained healthy rental values, while office properties show more variation depending on location, quality, and the types of tenants they attract.
Understanding these economic currents is essential for anyone looking to accurately assess commercial rental values today. The landscape continues to evolve, making local market expertise more valuable than ever.
The journey to understanding commercial rental values isn’t always straightforward, but it’s certainly worthwhile. When I work with clients, I emphasize that commercial rental structures vary significantly. Whether you’re dealing with gross leases (where the landlord handles most expenses), modified gross, or triple net leases (where tenants cover taxes, insurance, and maintenance), each requires a different approach to setting appropriate rates.
Market research is essential for success in commercial real estate. Without it, you’re essentially flying blind. I’ve seen property owners set rates based on gut feeling rather than data, only to have their spaces sit vacant for months. Taking time to understand current trends, vacancy rates, and comparable property values in your specific area pays dividends in the long run.
When evaluating properties, multiple factors influence rental values. Location quality remains king in real estate—a property on Main Street will command different rates than one tucked away in an industrial park. But don’t overlook other crucial elements like property condition, local economic conditions, and even government policies that might affect your property’s value in the marketplace.
Precision matters when calculating rental values. Start with accurate measurements of rentable square footage (remember, this differs from usable square footage), then apply market-derived rental rates appropriately. Even small miscalculations can lead to significant revenue differences over the life of a lease.
Don’t forget that property-specific factors can justify adjustments to base rental rates. That newly renovated lobby, energy-efficient HVAC system, or flexible lease terms might warrant premium pricing compared to similar properties lacking these features. These distinctions matter to prospective tenants and should be reflected in your rental strategy.
Finally, don’t underestimate the value of professional guidance. As one industry expert noted in our research, “Setting the right rent for your commercial property is crucial for attracting and retaining tenants while ensuring profitability.” Commercial real estate professionals bring proprietary data, current market knowledge, and strategic insights that can make the difference between an optimized property and one that underperforms.
At IPA Commercial Real Estate, we bring extensive knowledge of the Riverside, Inland Empire, and Southern California commercial markets to help property owners determine appropriate rental values, market their properties effectively, and secure quality tenants. Our approach combines brokerage expertise with property management capabilities, providing comprehensive support that addresses both immediate leasing needs and long-term property performance.
Professional Property Management Services
Whether you’re looking to lease a single property or manage a diverse portfolio, understanding commercial rental values in my area forms the foundation for successful real estate operations. The commercial real estate landscape continues to evolve, but with solid market knowledge and professional guidance, you can steer its complexities with confidence and achieve optimal results for your properties. After all, in commercial real estate, information isn’t just power—it’s profit.